Charts (Data)
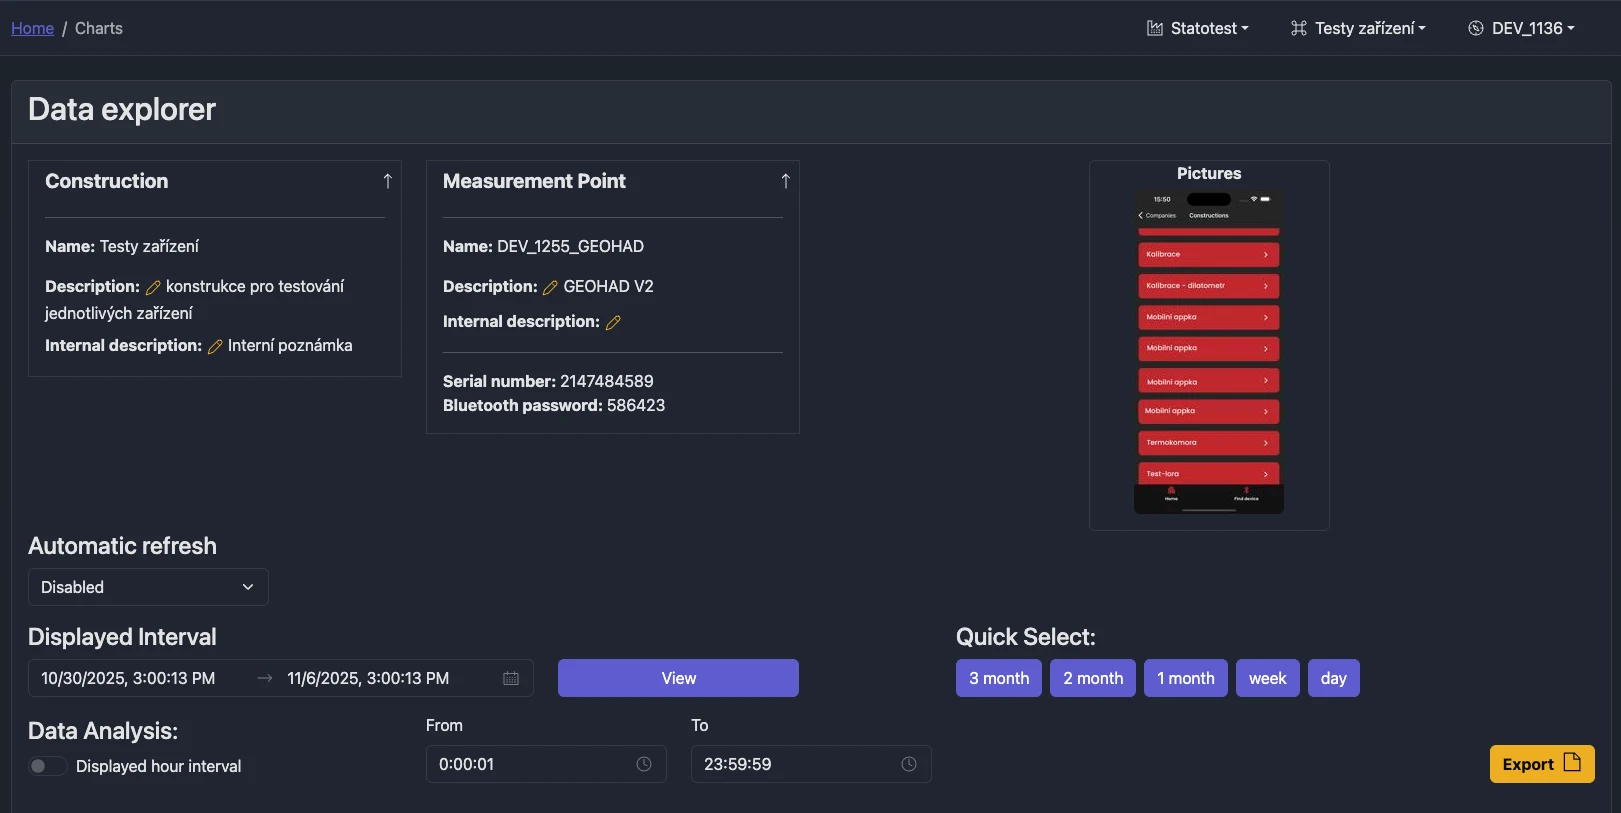
View and analyze measured values for a selected Measurement Point in clear charts, with quick interval controls, basic analytics, and per-channel parameter tuning.
Before You Begin
To access Charts, select:
- Organization — required
- Construction — required
- Measurement Point — required
Use the dropdowns in the top navigation bar to make your selections.
What you can do here
- Choose a displayed interval and quickly switch between common presets (3 months, 2 months, 1 month, week, day)
- Optionally limit analysis to a daily time window (e.g., 08:00–16:00)
- Auto-refresh charts on a schedule (1 min to 1 hour)
- Export data directly from the displayed charts to CSV
- Open the Tab Menu for:
- Measurement Summary
- Device Summary
- Parameters Settings
- Manage Templates (Construction Admin and above)
- Data Sharing (share data without user accounts)
- InfluxDB Tokens (Global Admin)
Quick start
- Select Organization, Construction, and Measurement Point
- Pick a date-time interval and click View
- Use Quick Select to jump to common ranges
- Open the Tab Menu to explore summaries, parameter controls, and sharing options
- Click Export to download CSV for the currently displayed series
tip
The sticky interval menu appears when you scroll, so you can quickly change the interval without returning to the top.
Export from charts
The Export button lets you choose which data types to export. Exported CSV reflects what you see in charts, including any active parameter-based renaming, units, precision, or filtering.

Tab Menu
Tabs live right under the interval selection. Each tab is documented in a dedicated page:
- Measurement Summary — list of measured data types and first/last data timestamps
- Device Summary — operational device data (e.g., temperature, humidity, battery)
- Parameters Settings — per-channel parameters for naming/units/precision, filtering, conversions, etc.
- Manage Templates — apply sensor templates to the current Measurement Point (Construction Admin and above)
- Data Sharing — create share links for viewing data without an account
- InfluxDB Tokens — Global Admin can create/delete tokens for external InfluxDB access; Organization Admin can view
- Markers — annotate chart data with named markers for events and observations
Troubleshooting
- “Choose Data Source” alert: ensure all three selectors are set (Organization, Construction, Measurement Point)
- “No data in interval” alert: adjust the displayed interval (Quick Select helps)
- Export disabled: at least one chart with data must be visible
Related
- Parameters overview (how parameters influence charts)
- External Charts portal (shareable charts without user accounts)