Basics
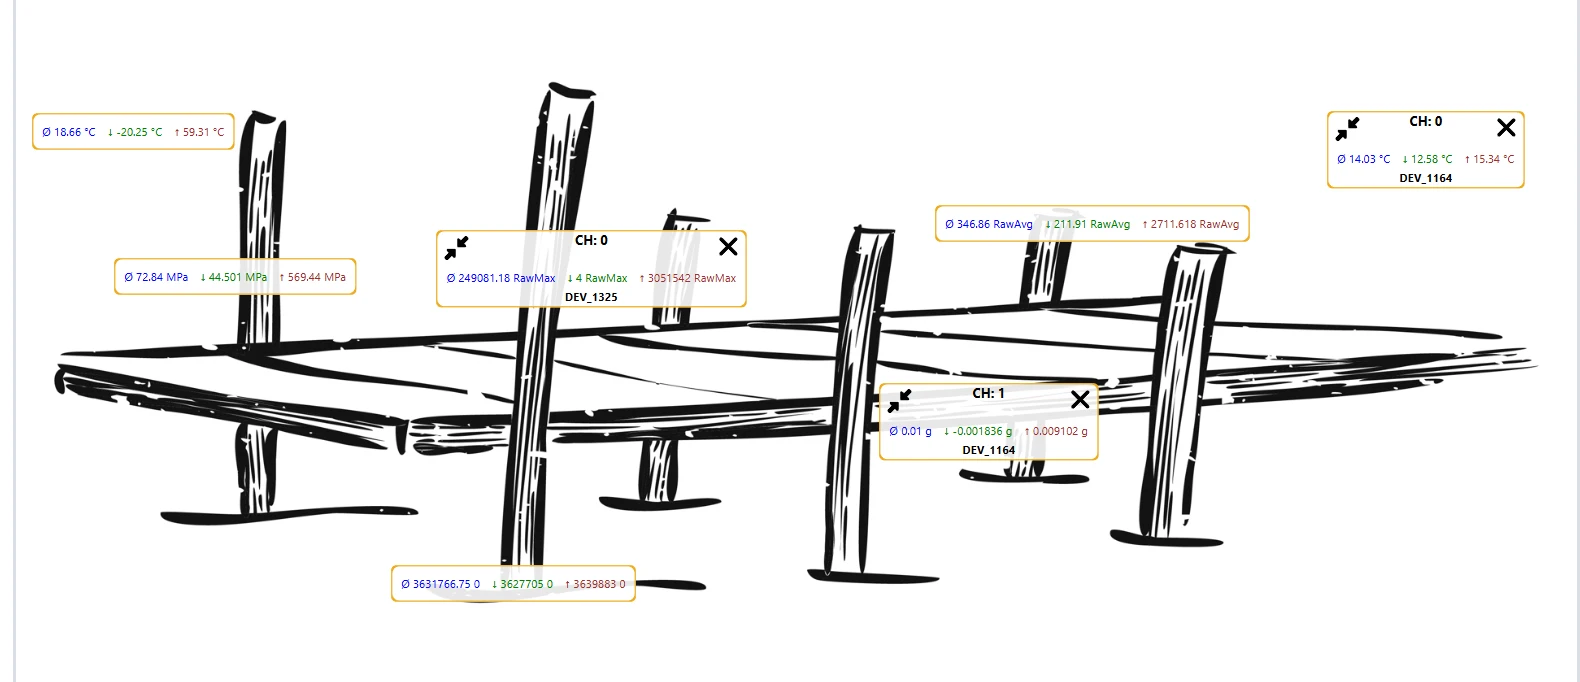
Construction View lets you place live sensor values directly on your own images or schematics of a Construction. It’s ideal for seeing what’s measured where the sensors actually are.
You can upload multiple images per Construction. Each image has its own independent layout of “value rectangles” you configure and save.
Before You Begin
To use Construction View, select:
- Organization — required
- Construction — required
Uploading images, entering Edit mode, and saving layouts are available to Global Admins, Organization Admins, and Construction Admins. All other roles have read‑only access.
Supported images: PNG and JPG only.
Layouts (rectangle placements) are stored with each image. If you delete the image, its layout is deleted as well. If you need to replace an image but keep the layout, contact administrators.
The values shown here match what you see in Charts: the same parameters, coefficients, unit conversions, and filtering are applied. You choose which data series to display (e.g., for Environment on a specific channel and sensor, show only Humidity and hide Temperature).
What you can do here
- Choose an uploaded image to use as the background
- Switch data view: Aggregated (min/avg/max over interval) or Last measure (most recent value in the interval)
- Pick a time interval and load data
- Enter Edit mode to add/remove sensor rectangles, drag them into place, and lock/unlock
- Upload or remove images for the Construction
- Export the current view to JPG or PDF (quick report)
Quick start
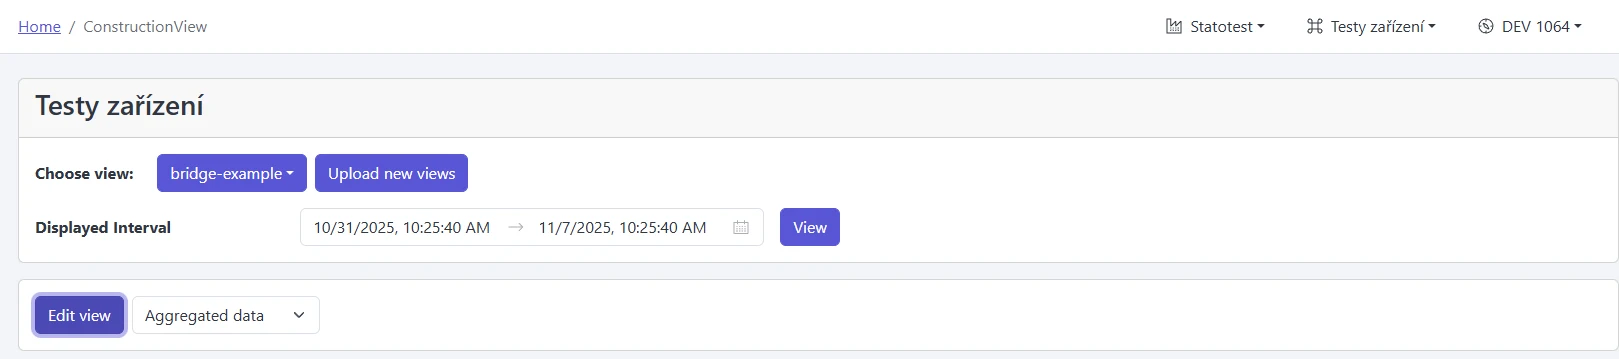
- In “Choose view”, pick one of the uploaded images
- Set the “Displayed interval” and click View
- Select “Aggregated” or “Last measure”
- Click Export → JPG or PDF to save a quick report
Each image keeps its own saved layout. Switching images loads that image’s layout.
Manage images
- Click “Upload view images” to open image management for the current Construction
- Add/remove PNG/JPG files; each file keeps its own saved layout
- Switch images via “Choose view” to load different saved layouts
Edit the view (place rectangles)
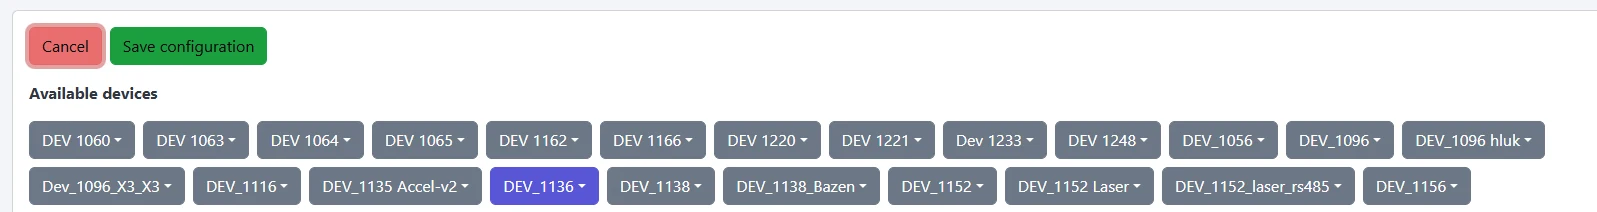
- Click “Edit view”
- Under “Available devices”, pick a Measurement Point and add a data series from the list — a rectangle is inserted
- Drag the rectangle to its real‑world position; hovering brings it to the front
- Use the expand/collapse arrows to switch detail (compact vs expanded)
- Click “X” to remove a rectangle
- Click “Save configuration” to store the layout with this image
Widen the interval and click View again. The dropdown only lists series that have data in the selected range.
- Header: channel and unit
- Aggregated: min / avg / max over the selected interval
- Last measure: the most recent value within the interval
- Series name (sensor/data series)
If you switch images or exit Edit mode with changes, you’ll be asked to save or discard.
Time interval and loading data
- Set the From–To date‑time range via “Displayed interval”
- Click View to refresh values for that range
- Aggregated reflects the selected interval; Last measure shows the most recent value within the interval
If you see an alert such as “No export token available”, ask an administrator to enable access for the selected Organization/Construction.
Export the current view
Use “Export current view” to produce quick reports:
- JPG — current layout as an image
- PDF — A4 landscape with the current layout
The export contains the background image and all displayed rectangles.

UI reference
- Choose view: dropdown with thumbnails and filenames
- Upload view images: manage PNG/JPG images per Construction
- Displayed interval: From–To + View
- Data view: Aggregated / Last measure
- Available devices: Measurement Points and their data series to insert
- Sensor rectangle:
- Drag to move (in Edit mode)
- Expand/Collapse via arrows
- Remove via X
- Hover to bring to front
- Export current view: JPG and PDF
Related
Troubleshooting
- "No export token available" or data won’t load
- What it means: your Organization or Construction doesn’t have export access enabled for Construction View.
- Fix: contact an administrator to enable data export access for the selected Organization/Construction, then retry.
- A sensor/series is missing in the dropdown
- Expand the “Displayed interval” and click View again; only series with data in the chosen range appear.